Hi, I am Jack Greene, and I have written books on time study based on dozens of years’ experience. You are welcome to use these time study forms, which follow, but frankly I’d like to expect that you use them correctly. Since many universities with IE curricula don’t even teach time study anymore, please allow me to point out some of the potential pitfalls, and suggest ways to raise your professional capability, inexpensively.
Time study is not rocket science, but it is possible to get in big-time trouble with incorrect application. Briefly,
You may be time-studying the wrong thing in the first place.
Very basically; the activity you choose to study, is it really necessary? Is it a value-added cost, in that the customer is willing to pay for it? Question one ought to be, should you remove the activity entirely?
If you are after product cost improvement, labor may not be the best place to look.
In your standard cost breakdown, is the job you consider large enough to make a difference? If you cut the time in half, will the result be meaningful? Can you get a better return, by chasing a bigger rabbit?
If you are studying capacity or output, which is a very appropriate use for time study,
Study first the constraint operations, the bottlenecks.
Technical time study errors can lead to unsatisfactory results
My guess is that you do not want to report a result that will prove to be incorrect.
1. The resulting rate you develop will, not may but will, be unreliable if you measure untrained people; study an un-documented or un-approved method, fail to evaluate output quality during the study; record an inadequate number of observations; don’t performance rate the employees as to skill, effort, and pace.
2. You will create an expected output rate that asks employees to produce much less than the correct number, if you do not develop the most effective method in the first place through methods study, don’t perform workplace layout analysis, don’t balance the interaction with other workers and machines, don’t identify and manage constraints on production.
Gain proficiency in work measurement
My book Time and Motion Study will tell you what to do and why, to perform and manage work measurement. See https://www.amazon.com/dp/1492221422
There is another option. It is a fact that time study depends on layout, and that both involve cost reduction.
To learn how professionally to deal with all three of these basic issues, consider purchasing Industrial Engineering, Theory, Practice and Application which includes all three of the other books, and more, at a lower price. It is at https://www.amazon.com/dp/1482301792.
There will be times when you need hands-on assistance, guidance or formal training with work measurement.
When that occurs, please contact Jack Greene, at 843-422-1298. For more information, please click https://jacksonproductivity.
There is no cost or obligation to discuss your situation and possible solutions.
Principles of time study and work measurement have classically been applied to industrial situations,
but they are also very useful to quantify what actually happens in many other situations; health care, construction, warehousing, back office, distribution, service, business.
Work Measurement Forms
Useful forms, at least before I-phones and Androids, included time study observation forms, flow charts, multiple activity charts. These forms, for stopwatch study or work sample, follow for your use.
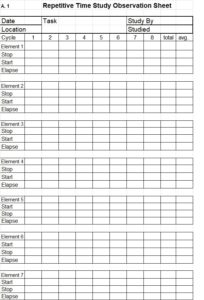
A. Time Study, four forms
1. Use for repetitive time study, when the same elements repeat every cycle. Record readings, then subtract for the elapsed time.
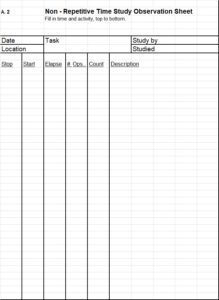
2. For non- repetitive time study; this form will accommodate less structured observations, to yield the information you seek.
3. For crew work sample; the form accumulates activity and workload information.

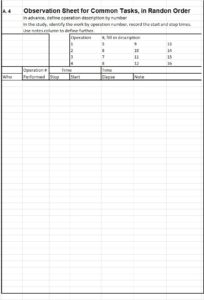
4. For time study when common tasks may be done in random order. Record time by tasks
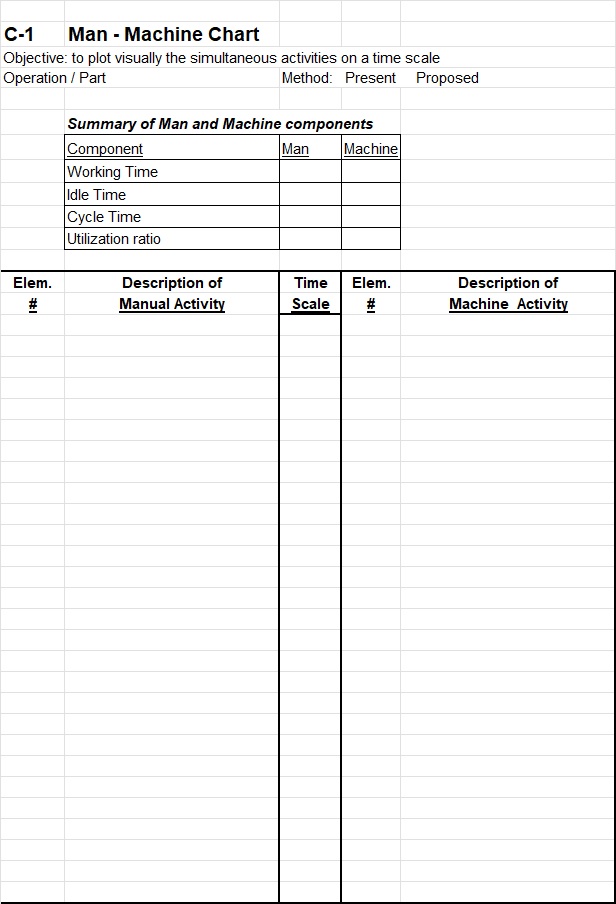
E.Multiple activity charts, two forms show relationship and the timing of work elements or activities done, by different people, people and machines, or hands. For activities done in parallel, it is often beneficial to define how tasks relate. Common uses of the multiple activity charts include:
- Man – machine Chart. Typically the objective will be to keep the machine producing at the shortest cycle time, by arranging operator work internal to the machine cycle rather than external. Activity by two or more people, or machines, can use this form as well.
Define the regular work elements both machine paced and operator paced, find interference, (when a machine or person prevents another person or machine from adding value, and arrange work to inimize it. You will want to place as much work as possible “internal” to the critical path, and as little “external” as possible, so that there is minimum wait for the constraining element. At this stage, you will want to consider the most effective relationship of machines and operators. One person for each 2 machines, or 3, or 4? Two people per 3 machines, or 4? Seven people per 13 machines? Machine cycles and operator cycles may be such that interference is common unless you are clever with assignments.
Also specifically decide whether to staff for low labor cost or high output. They are not the same. And low labor cost does not automatically mean low product cost, especially if you can sell more product when you produce it. If labor cost is low and machines are expensive, keep the machines busy by assigning more people. Assign more people if you need more capacity, and if you make a profit on the product.
After you have designed the operation as well as possible, there may still be interference because of mismatch in cycles, or unexpected malfunction or breakdown. If the interference is due to mismatch in manual and machine cycles that you can’t correct, build it into your expectations.
If interference is due to random breakdown, or jam up, or unpredictable cycle variation, there are two actions to take. First determine the frequency and duration of interference by observation or record-keeping. Correct the problem if possible. Second, once you have at last done all that you can do, allow for the interference. Use time study or work sampling to define how often the interference occurs, and add it as an allowance to the expectation.
2. Right hand / left hand chart, to breakdown work closely. Objectives can be to balance work between hands, remove ergonomic stress, identify when a fixture can perform work done by a hand, and further remove non-value-added elements. This analysis is especially useful in short cycle, repetitive tasks.
Pre-determined time literature will tell you that some hand motions can be done simultaneously, that the right hand and the left hand can both perform work at the same time. Other more difficult motions can be performed simo only with practice, and other most difficult motions can’t be done at the same time. Hand motions can be simplified, and made easier from the ergonomic standpoint and from the dexterity required. Feed parts, present them prepositioned, use fixtures, rests, slides, stops.

D. Manning charts. Manning charts will vary too much for a simple form to help, so the following will describe what’s needed to fit unique situation.
A manning chart is a spreadsheet used to calculate how many people are required to produce a given amount of product at a given product mix. The most important variable to specify is the production rate for each step in the process; engineered standards will produce more accurate and reliable results.
To set up a worksheet for your operation, use a sequence such the following, depending on the work measurement information that you have, the products, product mix, and volumes.
1. For each product, list production steps and direct labor hours required per step. In labor hours required include break, lunch, gowning, etc. Increase hours by the scrap rate and samples taken at each step, and downstream of the operation.
2. Multiply labor hours per step times production volume for the time period. It will definitely be more useful if you calculate labor by step, job title by job title, rather than in total.
3. Repeat for each product in the mix for the time, to total the direct labor hours at the product mix.
4. Add in the non-direct elements that occur in your operations: downtime or production hours lost, non-standard jobs, rework, relief operators, training; absenteeism. The result will be the total worked hours necessary in the time period.
5. The result will be the total worked hours necessary in the time period.
6. Subtract the hours expected to be performed on overtime. Divide by the straight time hours, in the time period. The result is the number of straight time employees.