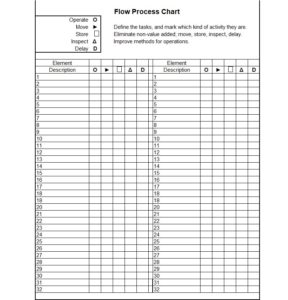
A flow process chart is a useful tool, to start just about any improvement project. What happens today?
Understand what goes on now. For Sure. Write it down.
Then, take step number one. Identify and remove waste.
The flow chart rulers us engineers used to carry in our pockets, were used to evaluate steps in a manufacturing process.
There are only five things that can occur during a step in a process; an operation, a move, a delay, an inspection, a storage. Note that four of these possibilities do not add value. Work of any type can be flow charted; products, paperwork, electronic documents. Trouble-shooting a problem is less predictable, but maybe up-front planning with a flow process chart there will really add value.
In Lean Six Sigma, the MUDA system promulgated in 2002 adds two non-value added categories to look for, Overproduction and Over-Processing.
Can’t find a pocket ruler and template, but the blank chart below will suffice.

